
World Macroconomics — I
Published on
Contents
In MMT circles, we appear to be currency perverts, but in fact MMT cares least about “the money.” But only an MMT’er will recognize this is so!
World Real Production Dashboard
A dashboard for some real production numbers at-a-glance. Number Per Capita and Absolute. By-country, and World-totals.
- Real GDP.
- Energy use.
- Oil.
- Food.
- Building and construction.
Here is the Dashboard (click here).
I recently added some nice bells & whistles, like country selectors. I you would like the stylesheet and scripts to download and process the data let me know.
One Interesting Impression
I guess I am one of thoise types who enjoy getting and visualizing data, but then I get bored. However, one very first instant impressions were:
- Canada is an energy guzzler!
- Venezuela and New Zealand rock in terms of food for the world.
- The 2008 GFC was a “fake crisis”. COVID was a real crisis.
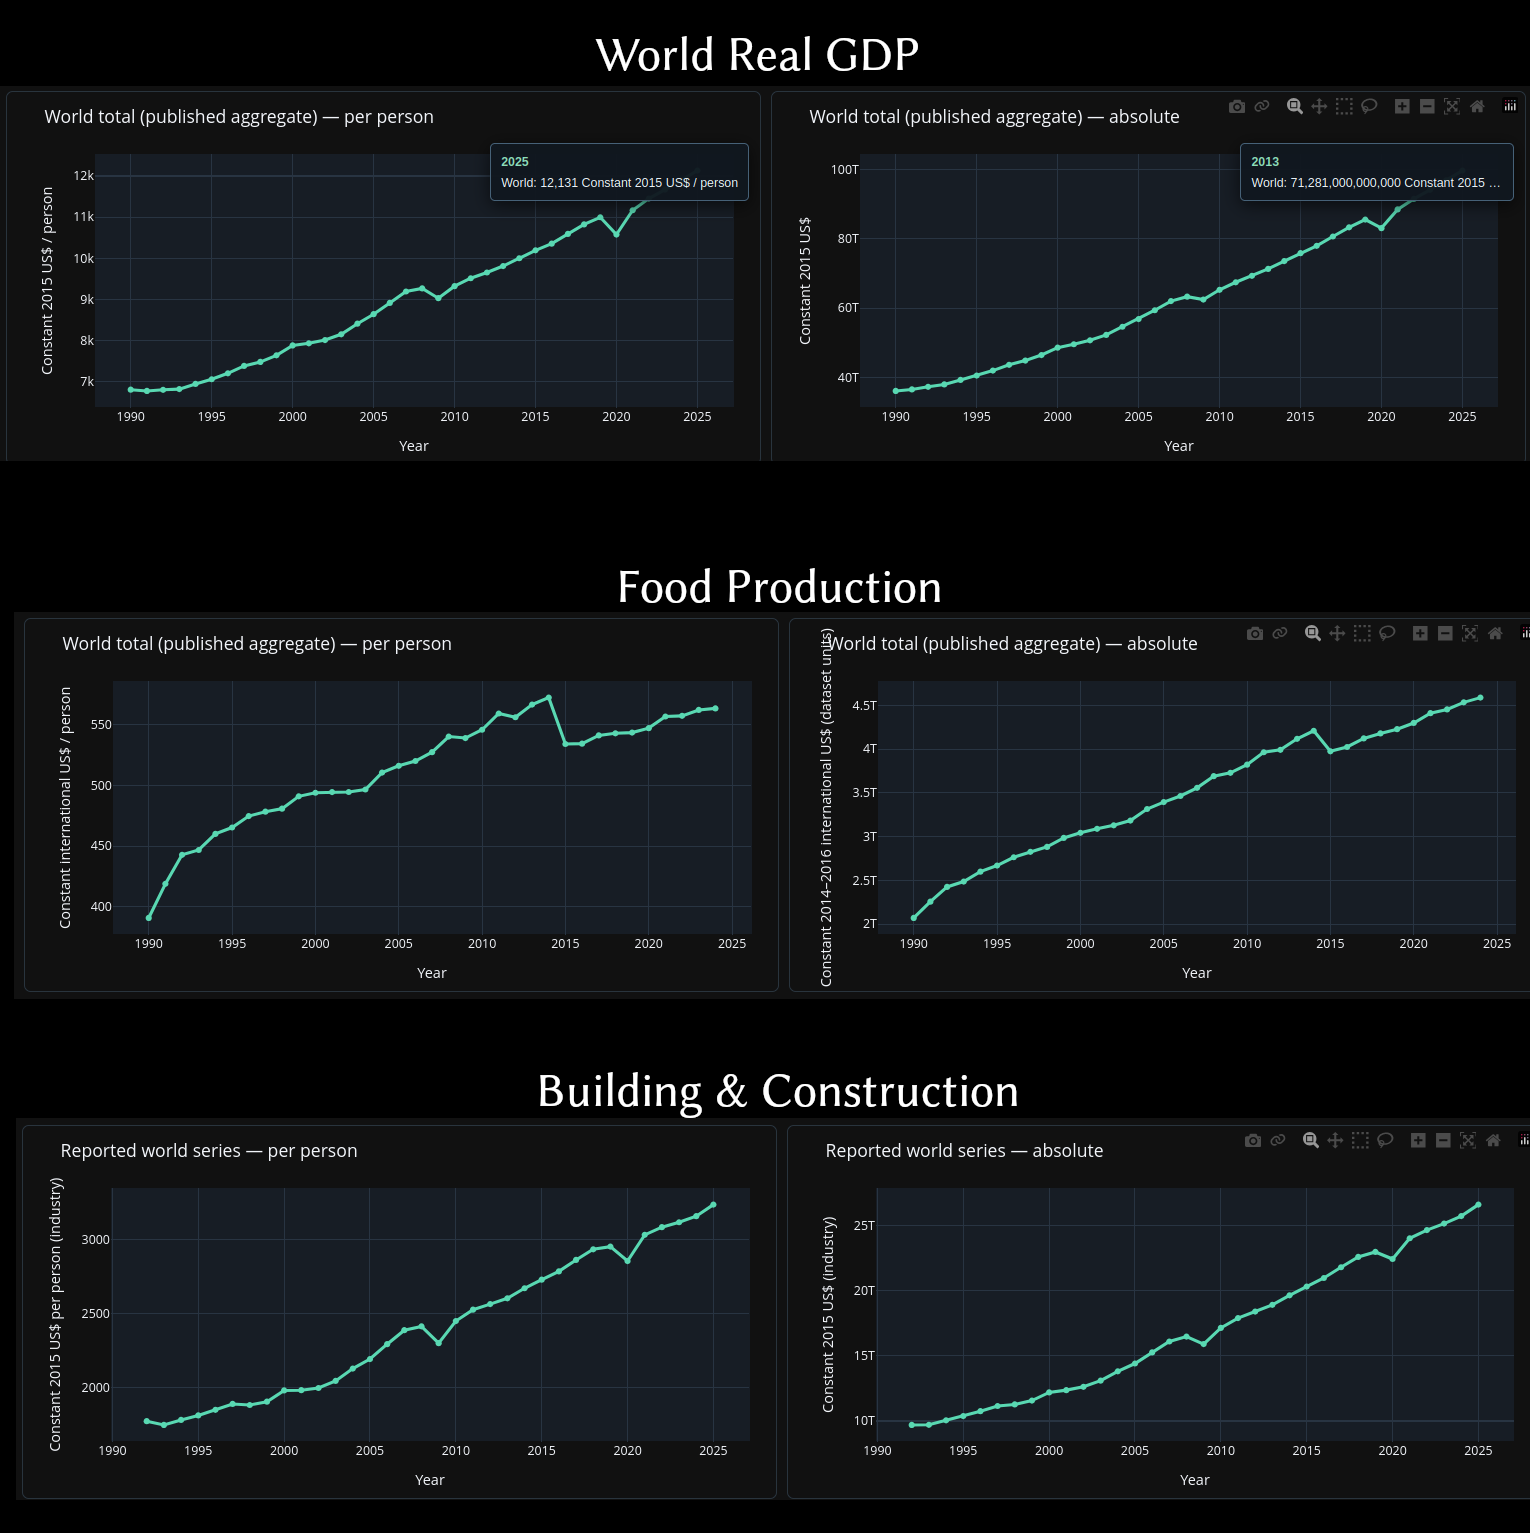
You see what I mean. We were still eating fine. There was no real economic crisis in 2008–2009. Building & construction blipped because it was in many respects a mortgage crisis. But COVID hit everything.
The Two Giant Blips, GFC-2008 and COVID, make you think the lockdowns should have been attenuated with a job guarantee, not “stay at home”. What we wanted was safe workplaces, but not a shut down and “work-from-home”. The 🅱𝘂𝓵🅛🅂𝖍𝗶🅃 jobers could have been given work-from-home arrangements.
No plans for updating this any time soon, but below are some development notes.
Dev Notes
An extensible, annual international comparison of production and material activity. I made one Python module per category; one common data acquisition layer; one static Plotly dashboard with blue inactive tabs and green active tabs. No FRED key is required: the World Bank and Our World in Data sources are better suited to global coverage.
I hope you go away an make your own for your own purposes. here are some hints below, plus, I am pretty sure these days any LLM like claude.ai can generate scripts for you, and even run them and produce you the CSV data and HTML results.
So,
There is no excuse for not looking at the real data!
Whether the FRED, BIS, OECD data sources are accurate is another matter, beyond my pay grade.
Install and run
python3 -m venv .venv
source .venv/bin/activate
pip install -r requirements.txt
python run_world_data.py                # fetch all complete series, replace CSVs
python run_world_data.py -u             # merge new/revised years into CSV history
python run_world_data.py --dashboard-only  # regenerate HTML without network
python run_world_data.py --dashboard-only -s left   # country chooser at left
python run_world_data.py --dashboard-only -s right  # or right
python run_world_data.py --dashboard-only -s top    # default: under the tabs
python run_world_data.py --series oil energy   # fetch only selected data sets
python -m pytest -q tests/
Outputs: world_data/*.csv and world_data/*.json (provenance notes),
dashboard/index.html, dashboard/style.css, dashboard/dashboard.js,
and dashboard/plotly.min.js (local Plotly). Open dashboard/index.html
directly.
Hosting the dashboard
I use Hugo for non-substack OhangaPai. It seems to work fine for mostly static websites. You should try to stick to static websites, they use less energy and load faster.
Dashboard country chooser
The title banner is deliberately compact; chart and tab controls have visual
priority. Every tab has one collapsible checkbox panel (with search, default,
all and none controls). Set its placement with -s or --selection-bar
(left, right, top). The default is top.
Country colours are a stable deterministic mapping of ISO3 code to colour,
so the same country retains the same colour across tabs and charts.
Each tab has four charts: country per-capita, country absolute, world per
capita, and optional world absolute. The default is Top 10 countries, ranked
by the latest available per-capita measure. The three mutually exclusive
checkbox shortcuts Top 10, Top 20, Top 100, and All replace the entire
country selection; manual country selection switches to a custom set. There
is only one ranking definition per tab, so the same countries appear in
the per-capita and absolute charts, even though their absolute ranks may differ.
The fourth chart can be toggled with Show world absolute. The world-per-capita
chart is always visible. Plotted legends contain only visible national traces.
Hovering a data point also produces a compact data readout that remains visible
for 30 seconds after the most recent hover. Plotly’s native hover label
still tracks the pointer as usual. Change HOVER_READOUT_MS in dashboard.js
if another duration is preferred; the value is in milliseconds. By default,
clicking anywhere outside the readout dismisses it immediately (clicking inside
does not). Control this when generating HTML with:
python run_world_data.py --dashboard-only --hover-dismiss-on-click
python run_world_data.py --dashboard-only --no-hover-dismiss-on-click
The generated JavaScript also exposes HOVER_DISMISS_ON_OUTSIDE_CLICK as a
boolean constant for manual configuration.
The all-countries option uses every economy with available per-capita data,
not only those in the top 100. On desktop, the layout is two columns:
per-capita charts on the left and corresponding absolute charts on the right.
Collapsing the chooser also contracts its width in sidebar mode.
What “constant-price value added” means
Value added is the value of a producer’s output minus the goods and services used up as intermediate inputs. It avoids counting the same value several times through a production chain. Constant prices revalue the output using prices from a fixed reference year, approximating quantity/real output changes rather than price inflation.
This vocabulary applies to real GDP and to construction (or the broader industry proxy). Food’s agricultural gross production value is measured at fixed prices but is not value added, since intermediate inputs are not subtracted. Energy and oil are measured in physical TWh and have no price deflation. Accordingly, the banner no longer claims all measures are “constant-price value added”; charts specify their units and definitions.
Sources and definitions
| Tab | Source | Quantity |
|---|---|---|
| Gross production | World Bank WDI NY.GDP.MKTP.KD | Real GDP, constant 2015 USD |
| Energy use | OWID energy dataset, primary_energy_consumption | Primary-energy consumption, TWh (not production) |
| Food / agricultural output | OWID/FAOSTAT agricultural-output-dollars | Farm-gate agriculture output, constant 2014–2016 international USD; broader than food |
| Oil production | OWID energy dataset, oil_production | Extracted oil, TWh energy equivalent |
| Building and construction | World Bank WDI NV.IND.CNST.KN, NV.IND.CNST.CN, NV.IND.CNST.CD; fallback NV.IND.TOTL.KD | Construction value-added constant local currency converted at 2015 USD/LCU ratio if available; otherwise broader real industry including construction proxy |
The food proxy includes non-food agricultural products and is not food calorie production, tonnes, or food security. The construction conversion is only an approximate constant-USD cross-country comparator, not PPP-adjusted; missing base-year construction observations cannot be converted. Real GDP is value added, not material gross output. These are complementary measures, not interchangeable definitions of physical output.
Construction coverage warning: The construction-specific WDI series may
be retired or sparse. If fewer than 20 economies report construction in 2020
or later, the script explicitly switches to industry including construction,
which is not construction alone. Inspect world_data/construction.json and
the data-source caption before interpreting the construction tab.
World totals and rankings
- Published World rows (when present) are used for world totals; otherwise the chart honestly says sum of reporting economies, rather than world total.
- Per capita is the annual quantity divided by population. All country rankings are sorted by the latest available per-country observation and therefore may combine reporting years; the full historical charts show missing years.
- Top 10/20/100 charts are separate for absolute and per-capita measures.
- Chart comparison may be visually busy at 100 series: click legend labels to isolate or hide countries; double-click a country to select it.
Incremental updates
World Bank queries with -u request the last two years plus the latest
year in the cached data, to accommodate revisions, merging by country/year.
An ordinary run starts in 1990 and replaces the CSV. OWID energy and
agriculture are published as unified CSV snapshots, so each refresh downloads
the whole source; the saved CSV is still de-duplicated by country/year.
There is no misleading claim of universal API-side incremental retrieval.
Add a new category
Create a module exposing KEY, TITLE, DESCRIPTION, UNIT, PER_UNIT,
RANKS and collect(update=False) returning rows of country,name,year,value,source,unit.
Add the module to MODULES in make_dashboard.py. A populated CSV adds a
new tab automatically. Country codes should be ISO3, global aggregate WLD.
Update only the dashboard with --dashboard-only after changing visual logic.
CSV and HTML are generated artifacts and can be checked into a data repository.
Do not check a .env file or API keys into Git.
| Previous chapter | Back to | Next chapter |
| NZ Econ I | TOC | MMT ODE Models |